Visualizing climate change in Monterey County
For almost a year I have been working with the Pacific Grove Museum of Natural History on the Carmel River, the largest source of drinking water in Monterey County. The museum wants residents to understand how local and global pressures are degrading the river.
I built their site, thewatershedguardians.org, which collects the research the museum does with CSU Monterey Bay. I also work with the researchers directly, helping them gather river data like pH and salinity and turn it into something you can look at.
The problem
Rainfall is short and nearby farms irrigate heavily, so the Carmel riverbed is drying out. Seawater seeps into the pockets beneath it. Salt water reacting with the river rocks pushes the pH up, which kills fish that need the old conditions. Steelhead trout are one of them. With fewer trout, the bacteria they used to eat spread, and the water needs expensive treatment before anyone can drink it.
Researchers around the bay are measuring this at points along the river. They track:
- pH
- Alkalinity
- Salinity
- Flow velocity
- Water temperature
- Depth
For each one they have a threshold that separates a healthy river from a struggling one.
My job was to make the data easy to read. The researchers wanted to spot dips and spikes along the river's course, compare sites against each other, and show the results in meetings without explaining a spreadsheet.
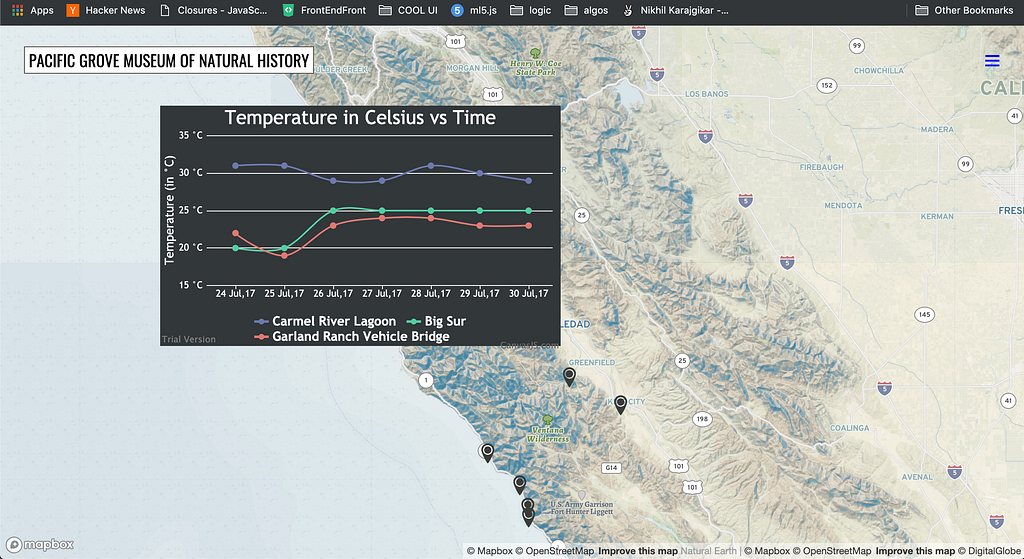
Here is one of the charts:
How it works
- Mapbox renders the map, with a marker at each site we have data for.
- D3 draws the chart for a site. You pick which measurement to plot against time.
- The data lives in Google Sheets. The site reads the sheet, converts it to JSON, and feeds that to D3.
What is next
- Open the tool to anyone. We want local high school teachers to use it for watershed and environmental science classes.
- Explain each measurement: what it is, how it affects river health, and what range is healthy.
- Add charts for every site. Right now only Salinas and Big Sur have them.
- Say what to do about it. The site shows the river is deteriorating but not how to help. We plan to research local policy so residents know which measures to support in upcoming elections.
What I learned
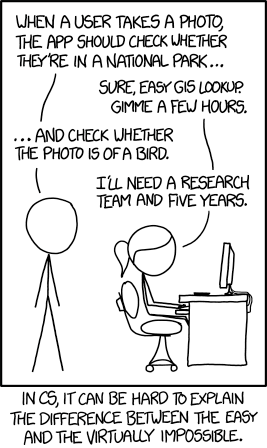
I was the only developer, and the researchers I worked with had not built software before. At first I struggled to explain timelines. Things that look easy from the outside take longer than expected, and things that look hard sometimes take less.
It reminded me of this xkcd:
I also had to get better at describing my work in terms of outcomes rather than process.
You can see the project at The Watershed Guardians and the Pacific Grove Museum of Natural History.